
From the first glance to the last action point.
Performance against the plan
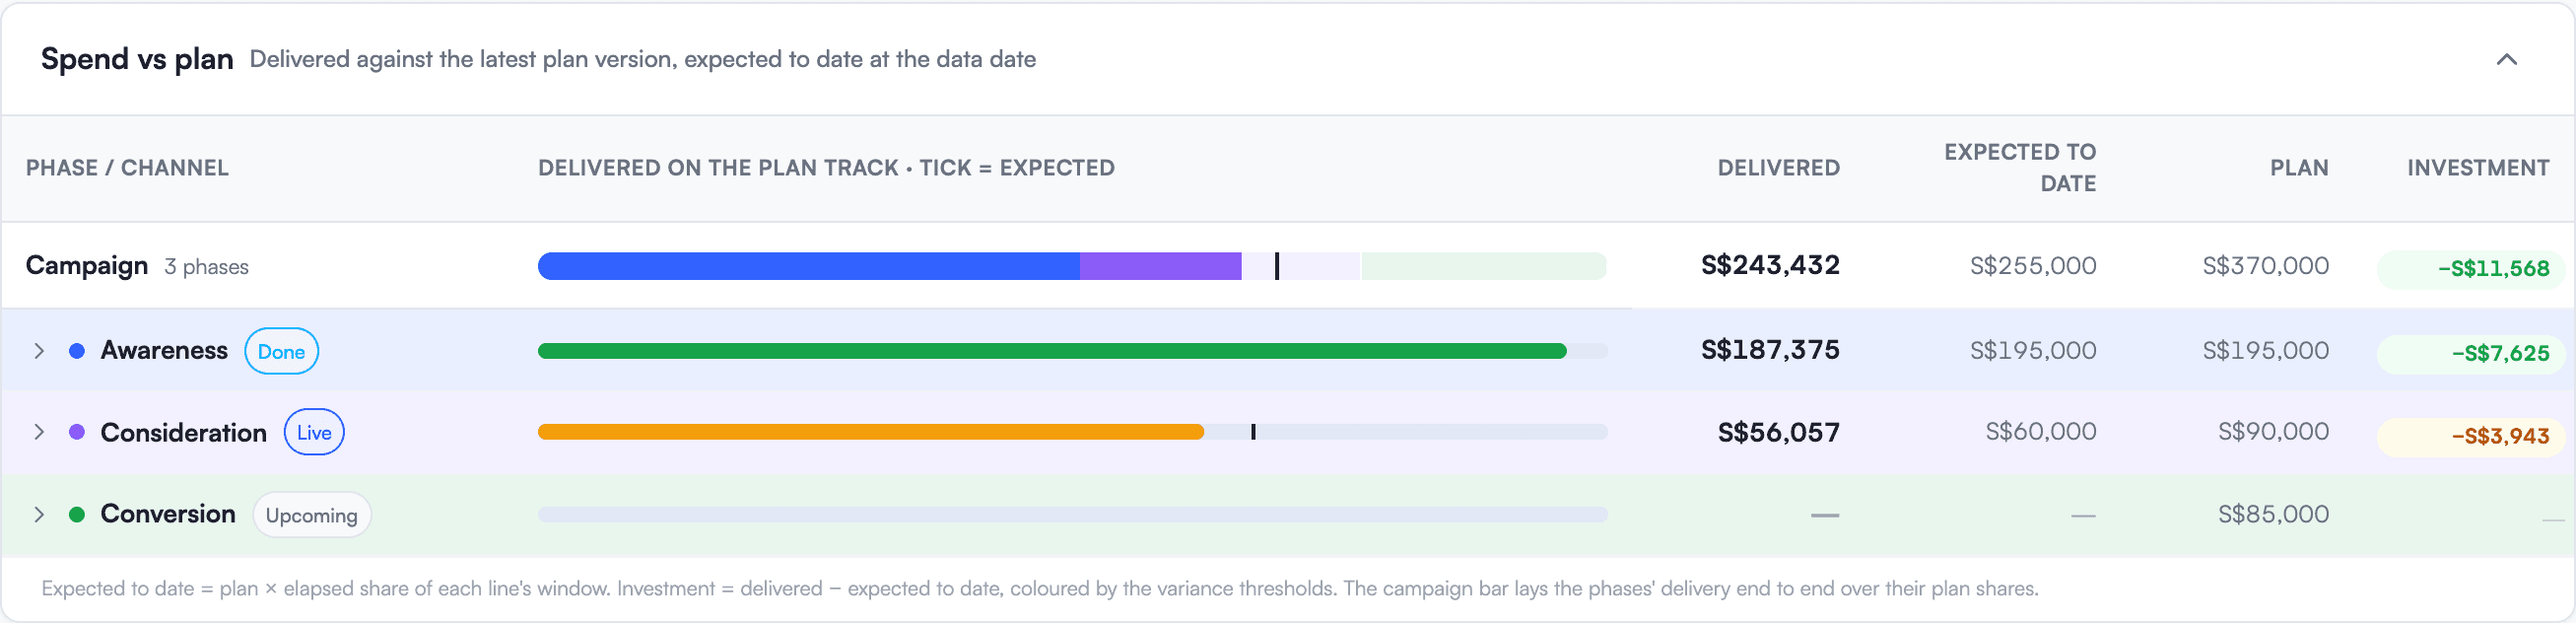
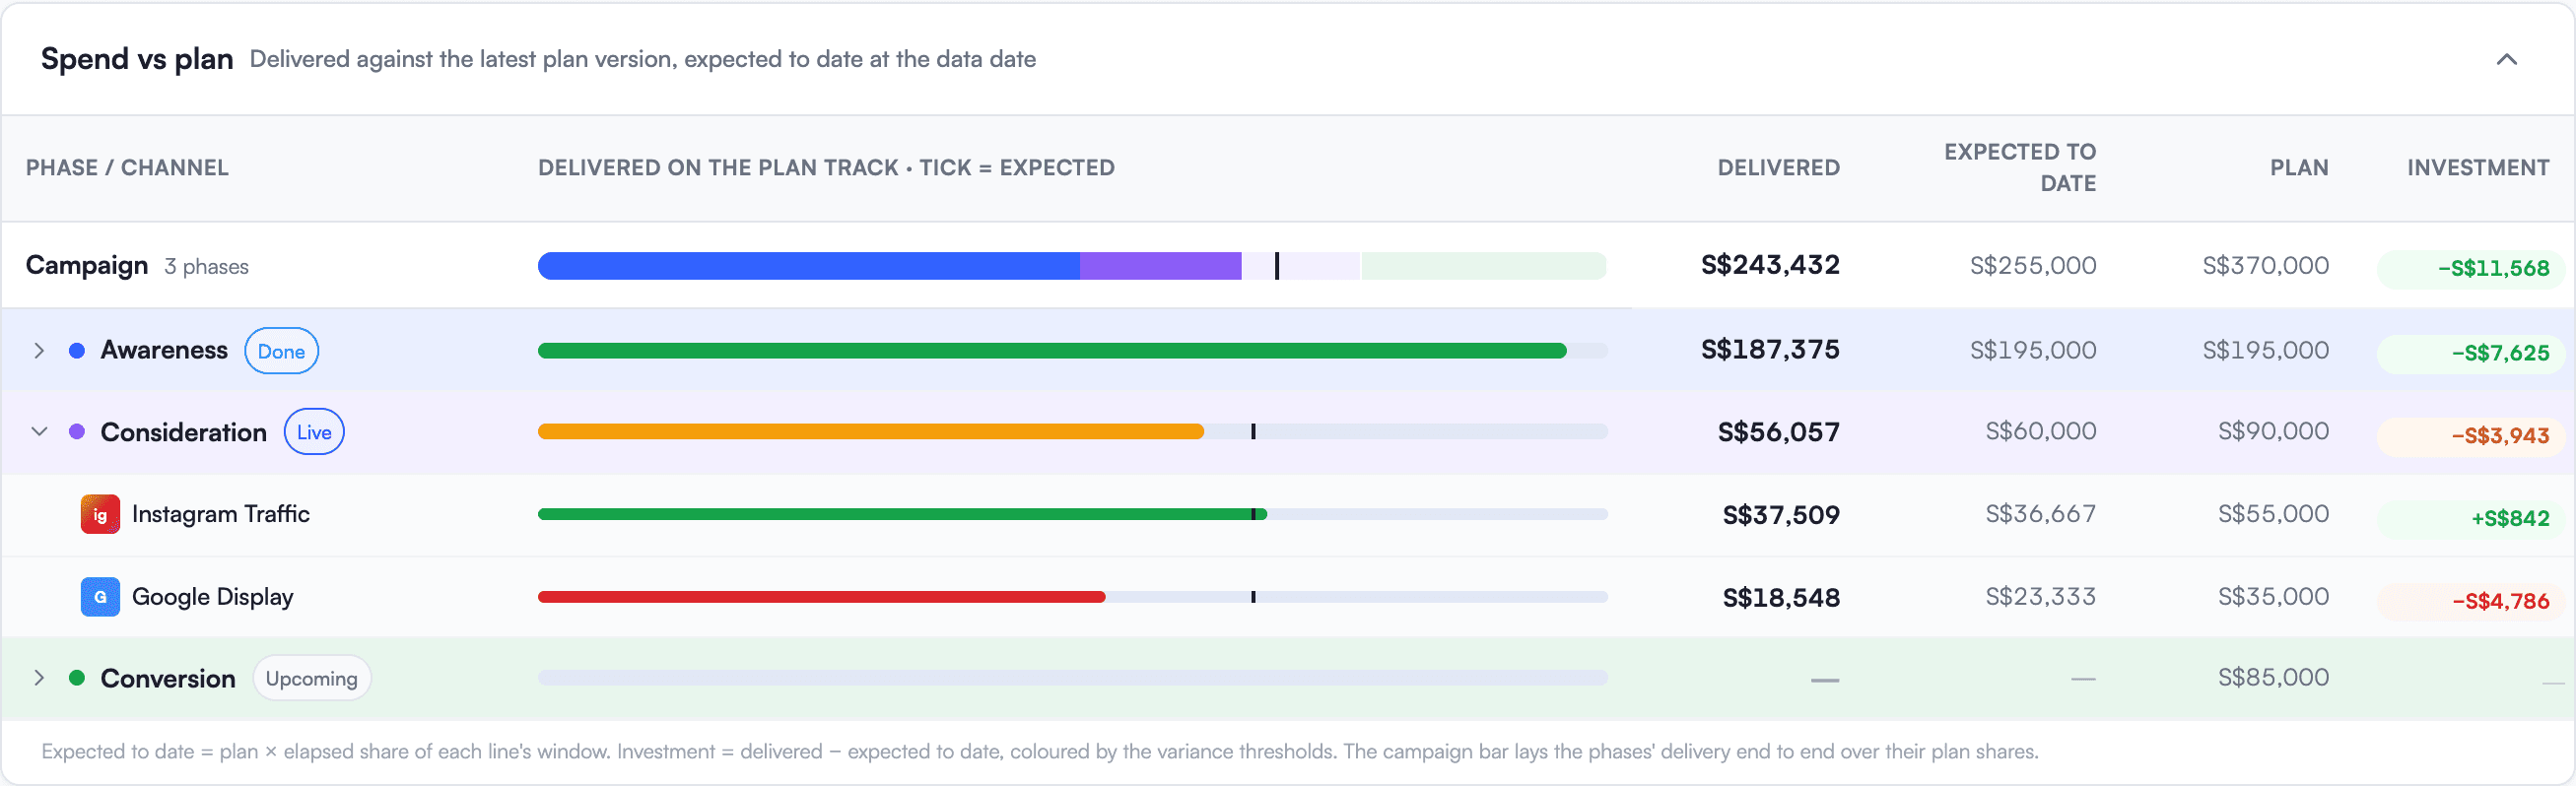
See pacing at a glance: what is over, what is under, and by how much, for every phase and channel. Switch the comparison to week on week to see how the campaign is moving.
Custom funnel visualisation
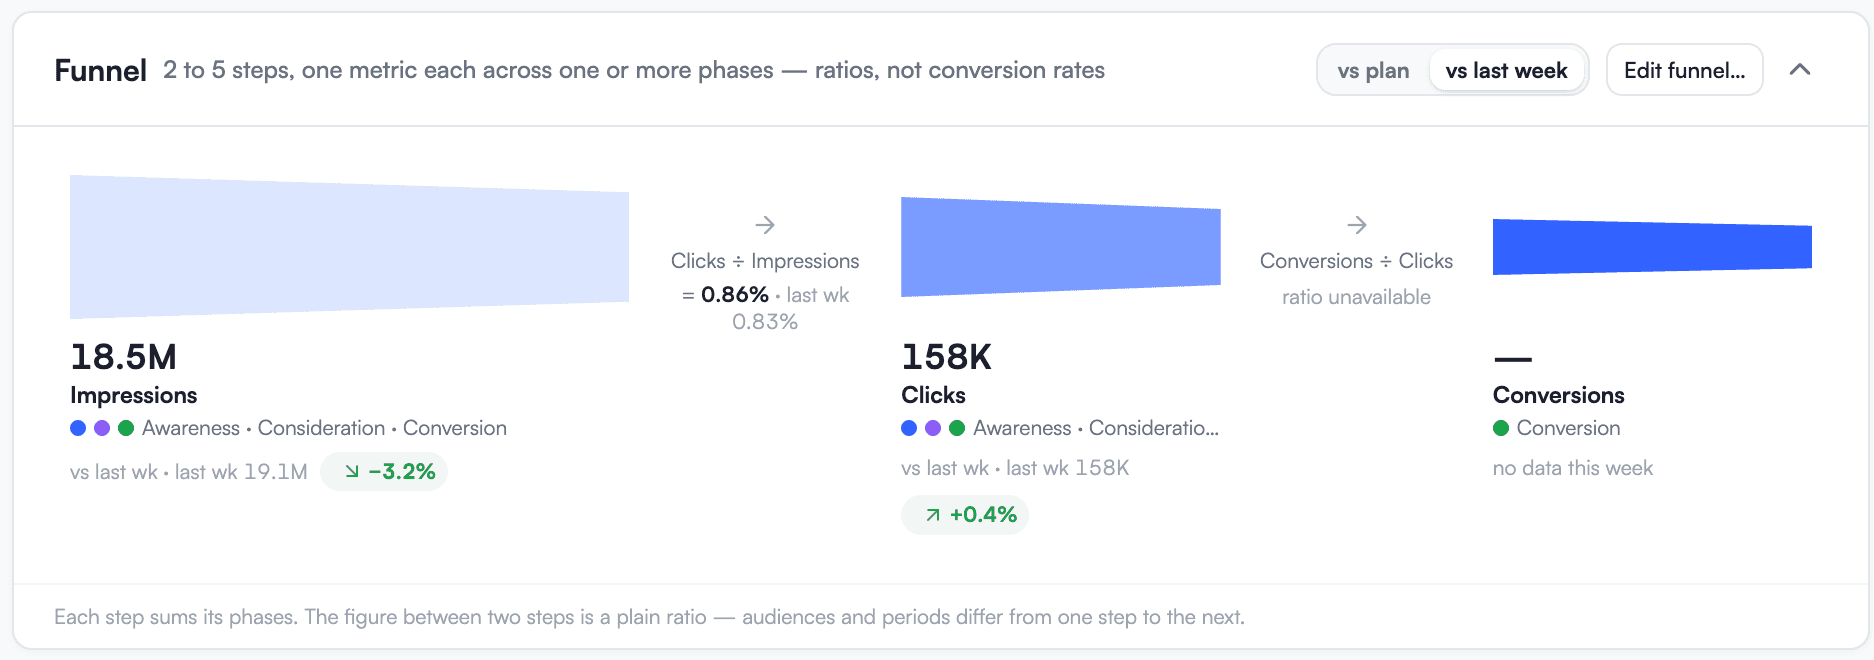
Build the funnel that fits your campaign: two to five steps, one metric each, across one or more phases, with the ratio between each step.
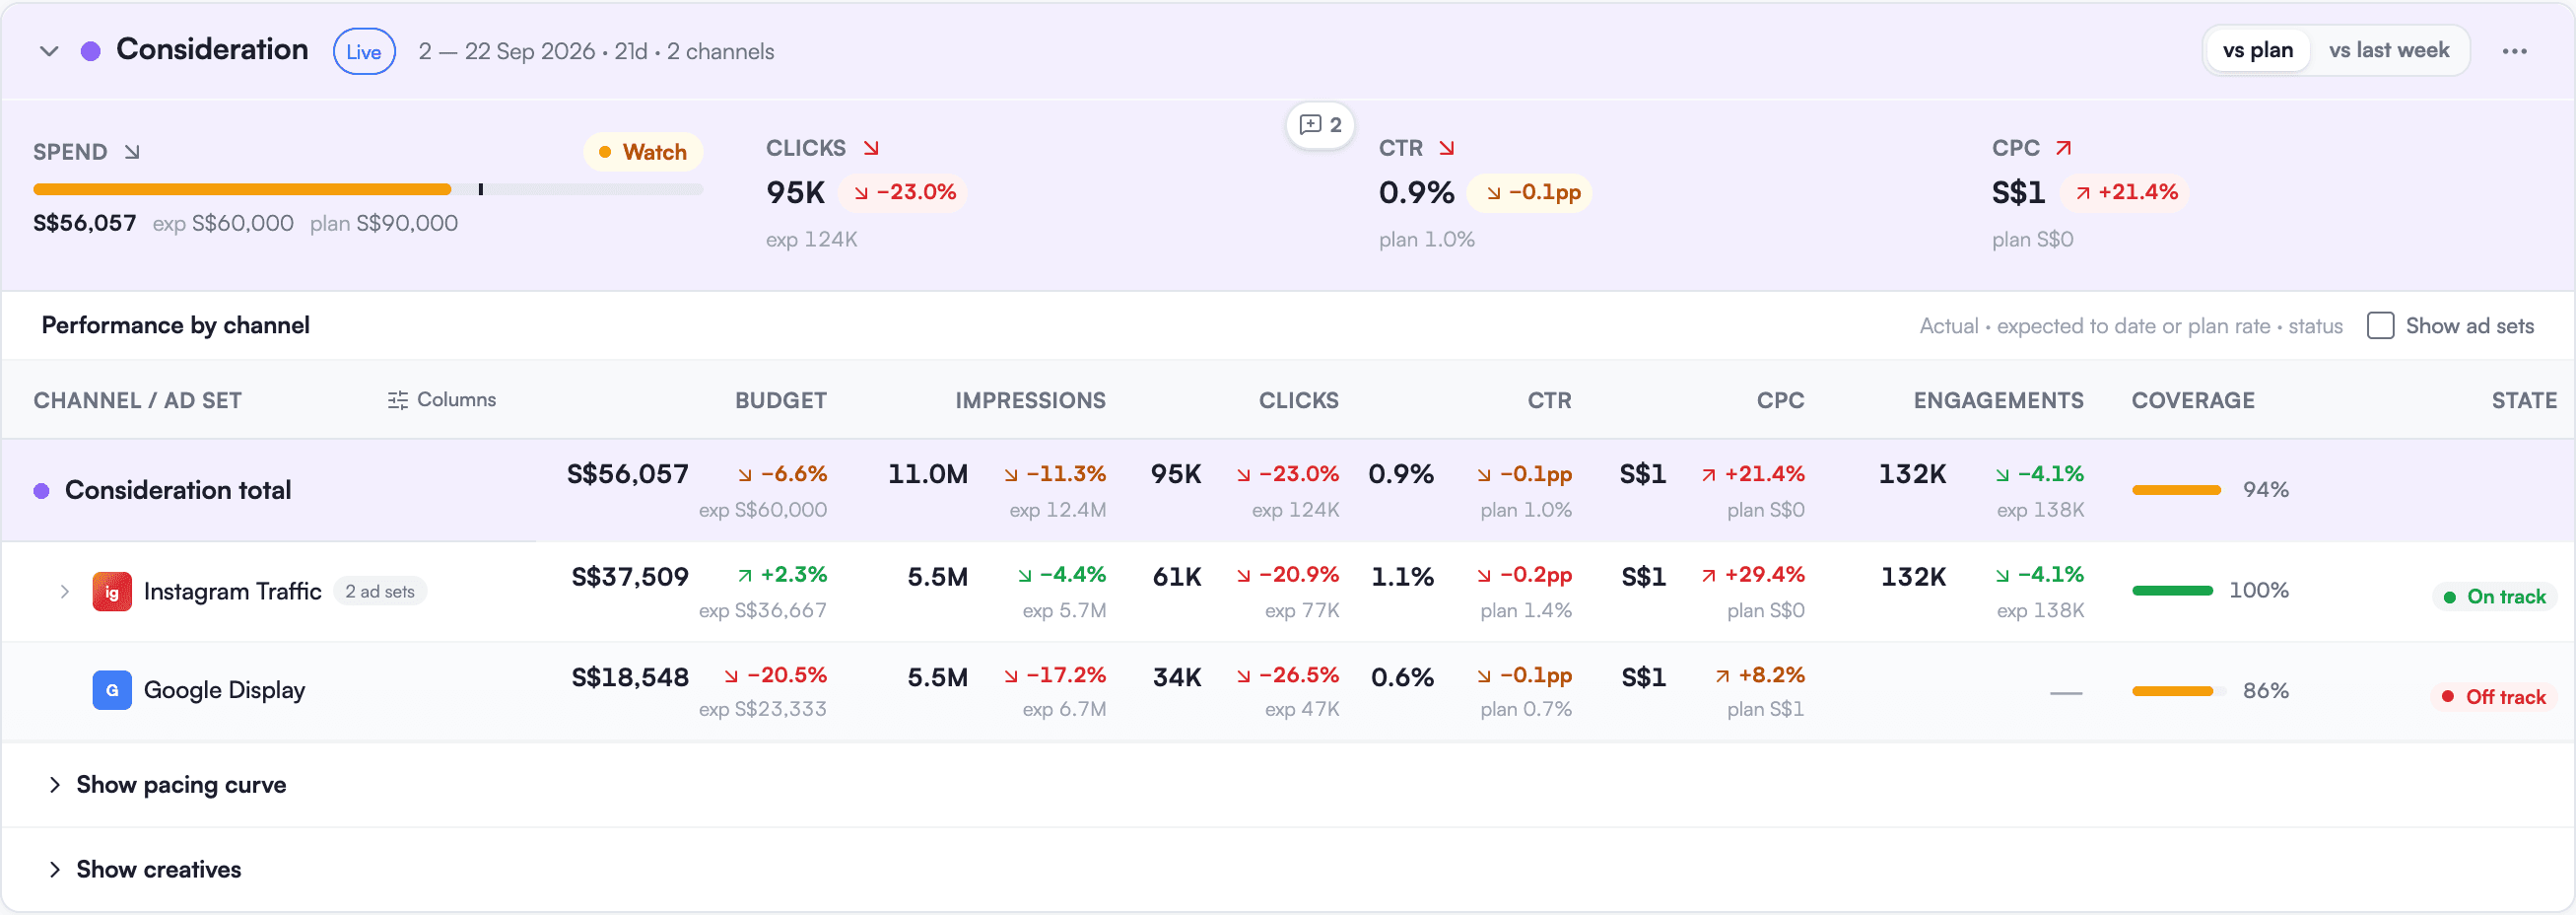
Detailed tables for in-depth checks
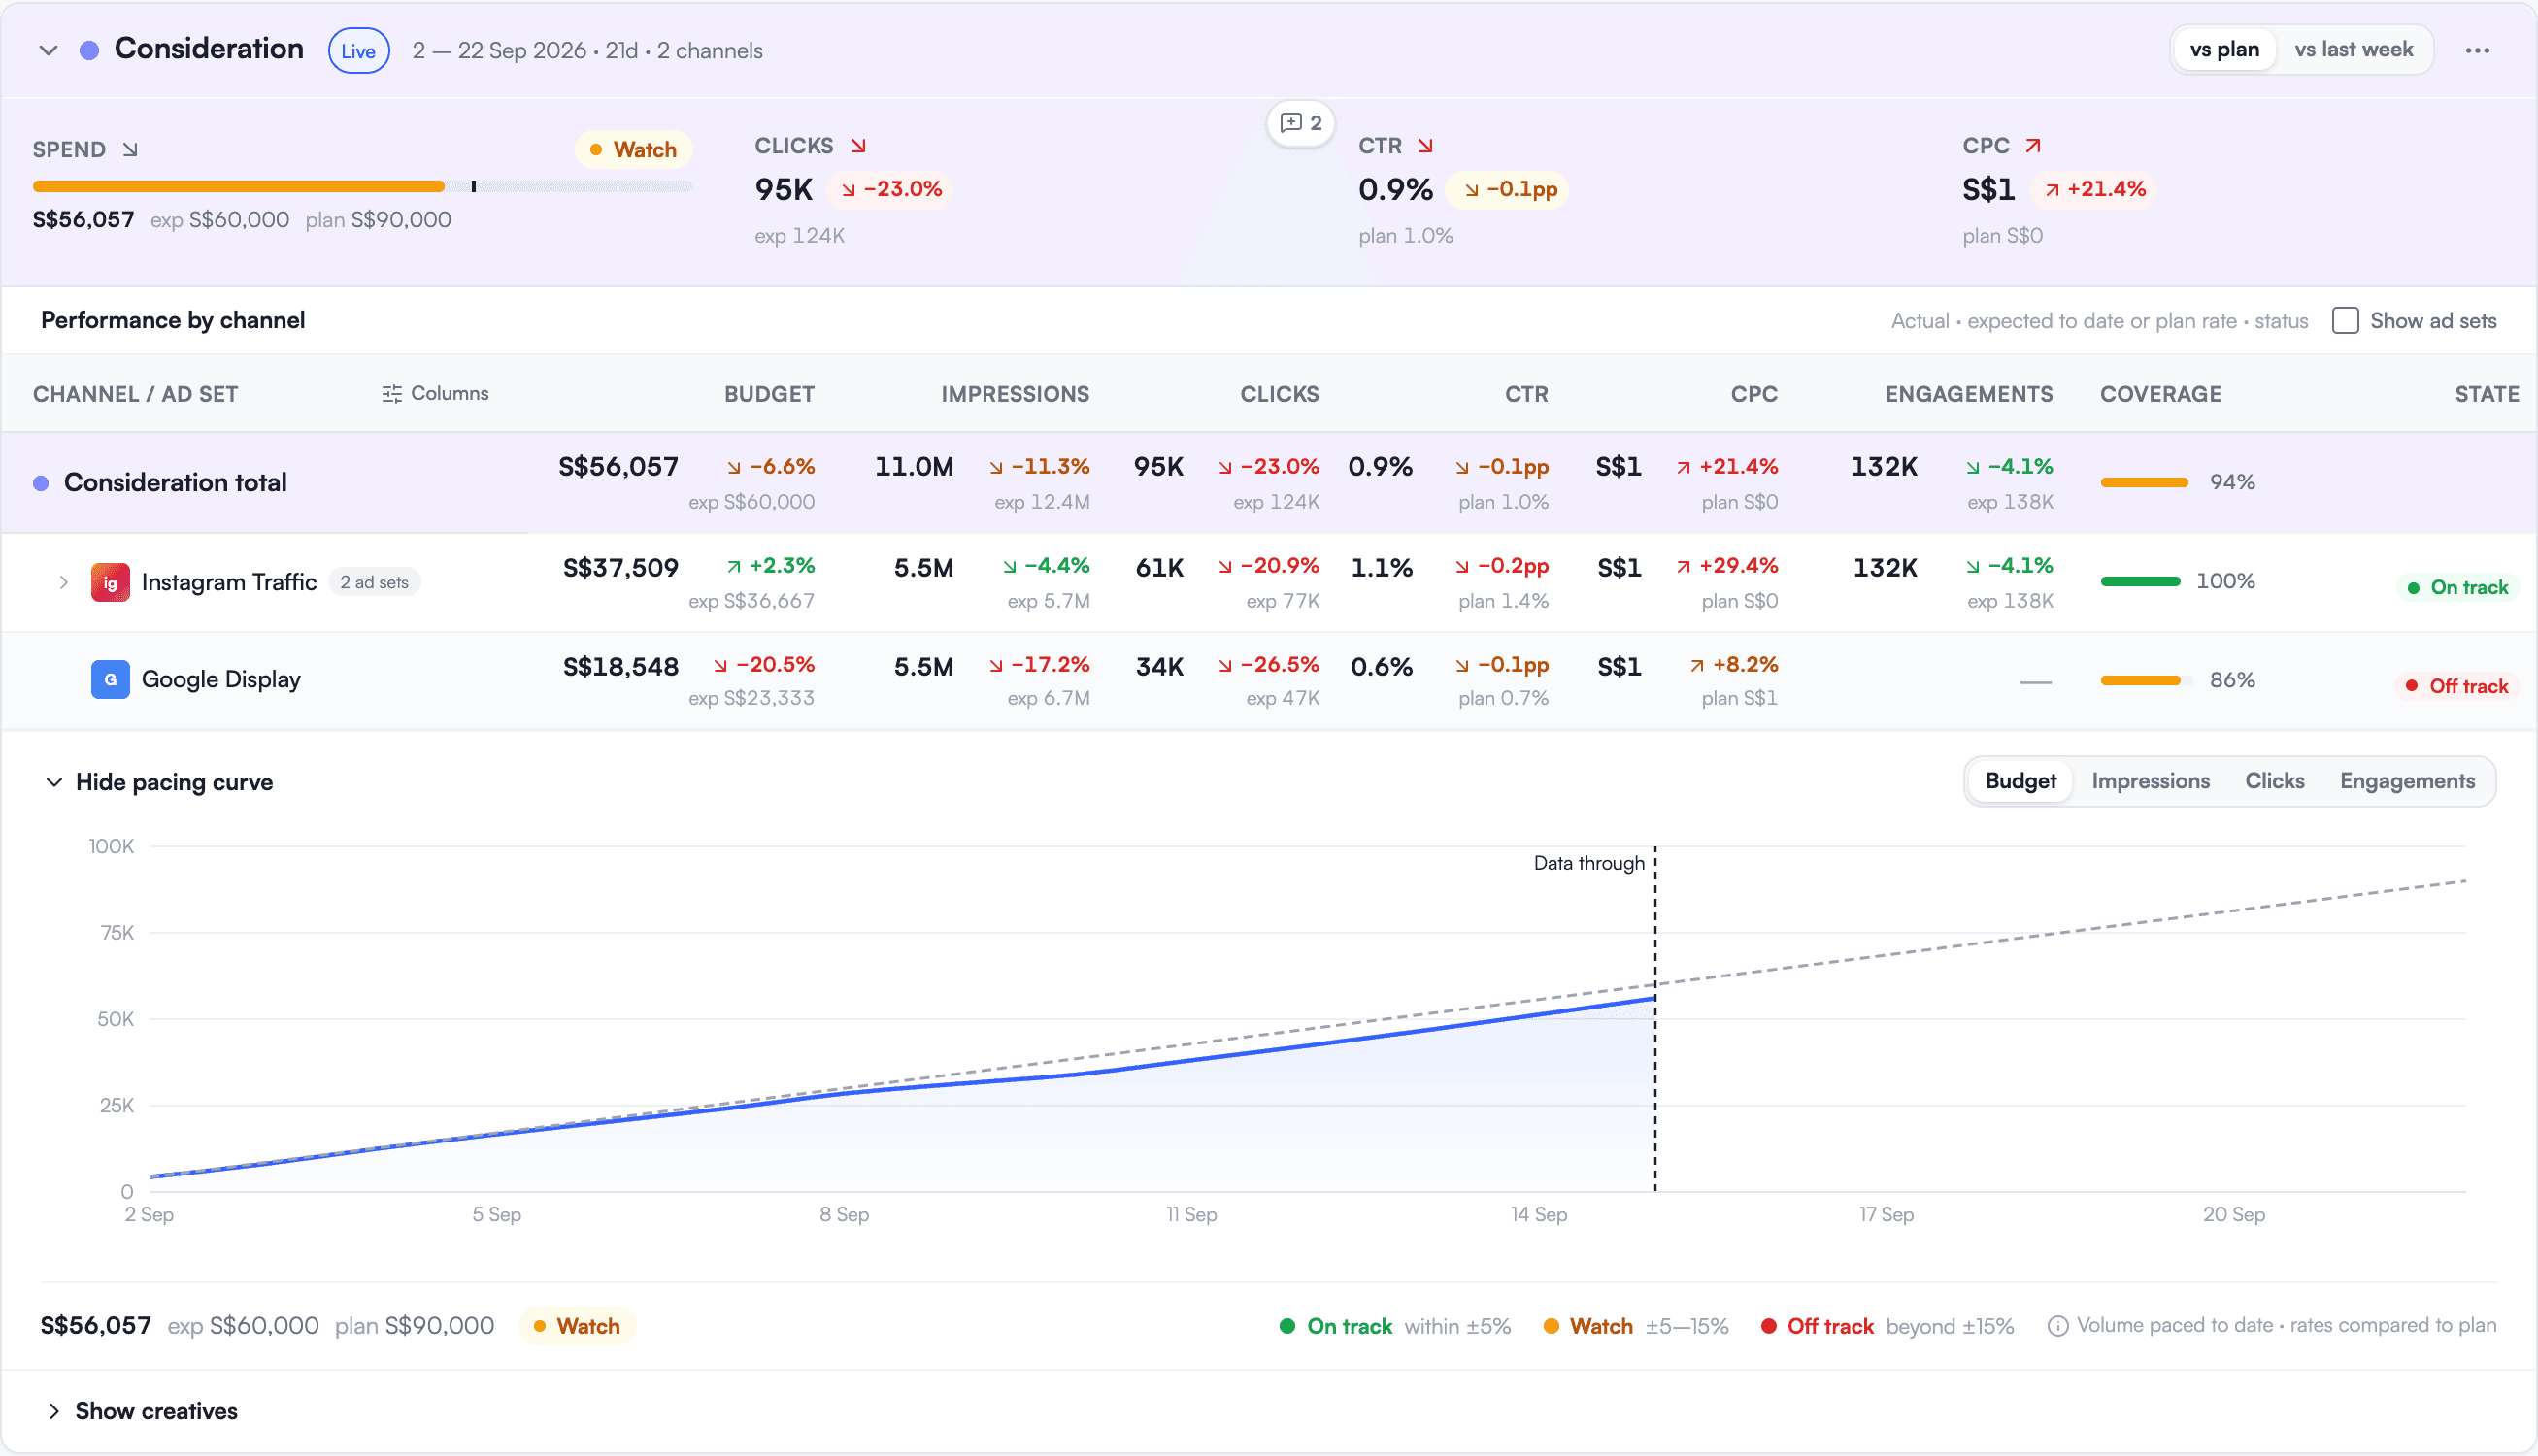
When a number needs a closer look, the table view lays out every phase and channel line by line, against the plan and against last week.
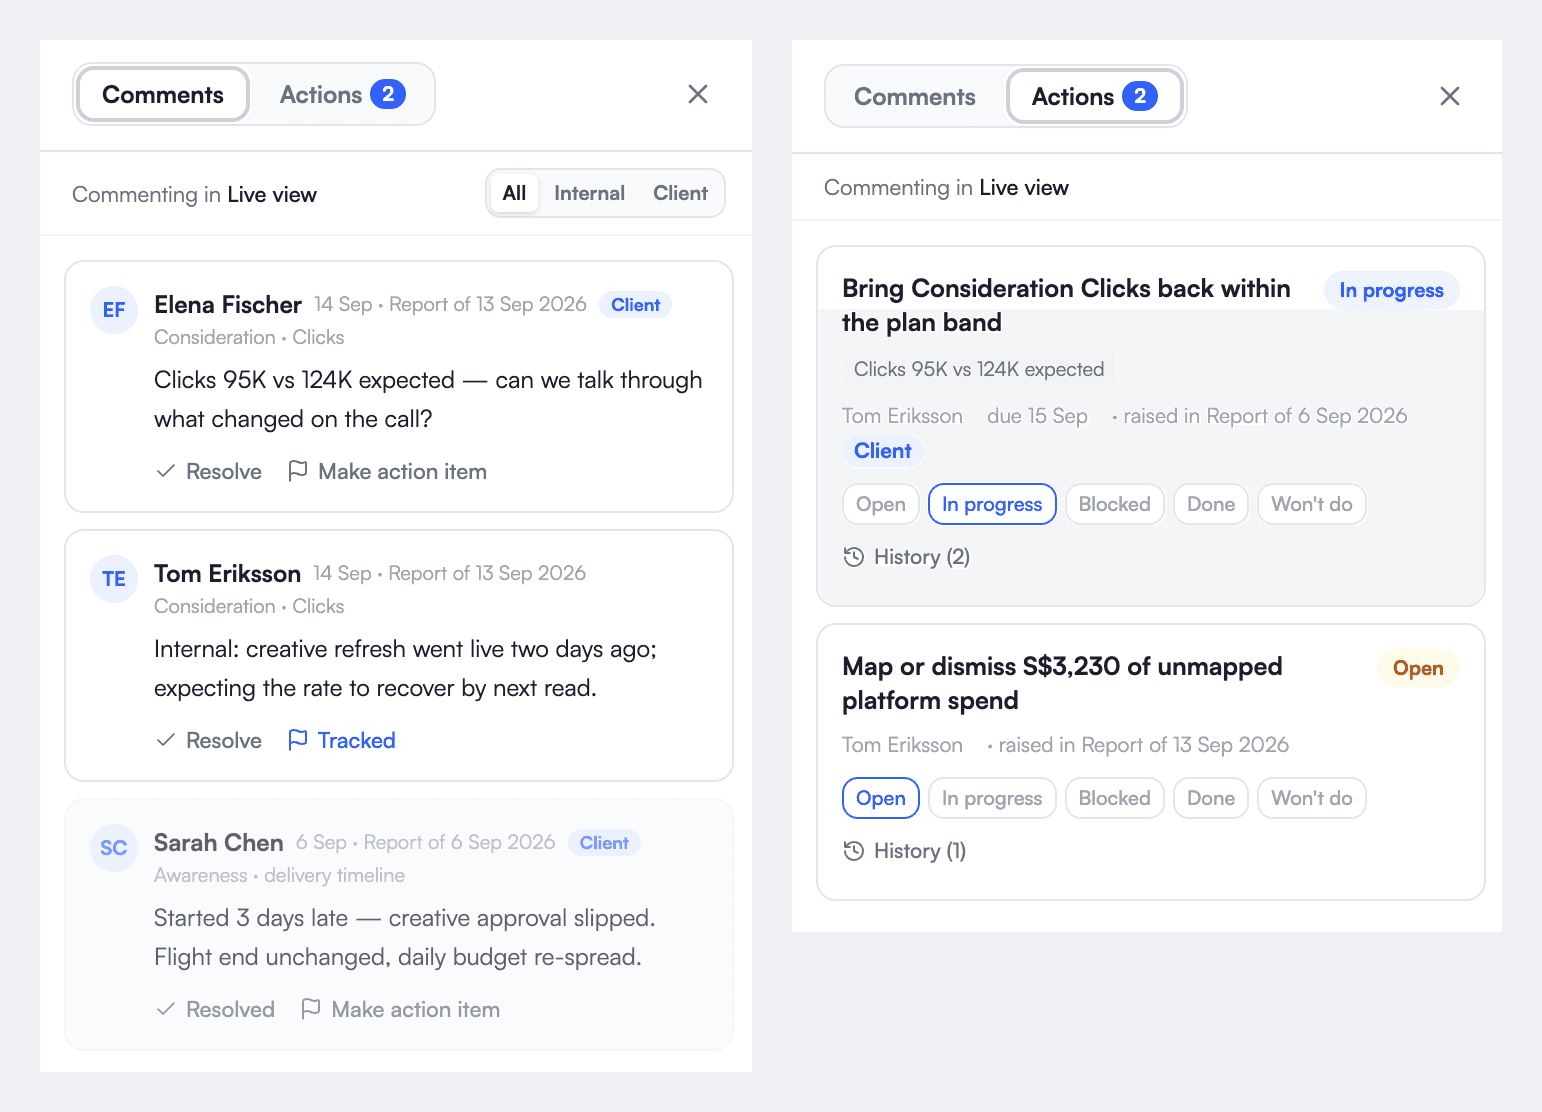
Every action point, tracked where it was raised
Comments are attached to the exact element they are about, and any comment can become an action item with an owner, a due date and a status. Week after week it stays where it was raised, so you never lose an action, or what it was about.